Introduction
A Linux process can be terminated for memory pressure even when the host still appears to have free RAM. This often happens in environments that use control groups to limit a service, container, or group of processes. The host's overall memory view and the workload's local memory view are not the same thing. A service can reach its cgroup limit while unrelated workloads continue to run normally.
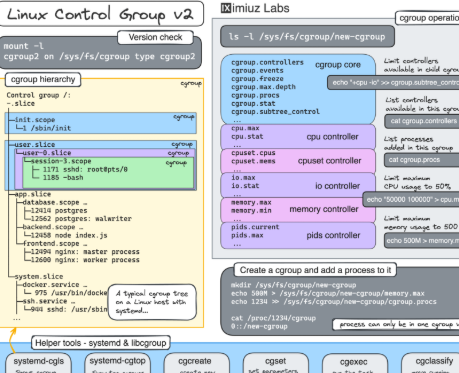
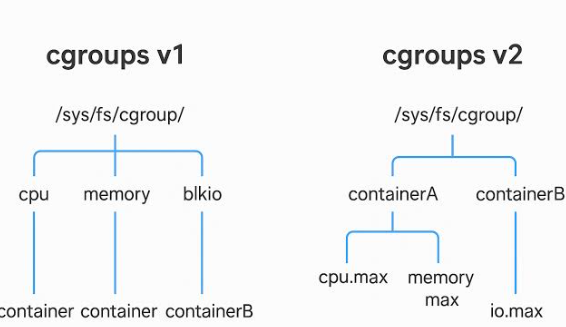
Cgroup v2 provides a unified hierarchy for organizing processes and applying resource controls. Its memory controller exposes usage, limits, events, and statistics that help an operator understand what happened. This article walks through a disciplined investigation of memory limits on Linux with cgroup v2. It emphasizes identifying the correct cgroup, interpreting counters, relating events to application behavior, and changing limits only after confirming the workload's requirements.
Confirm the Host Uses cgroup v2
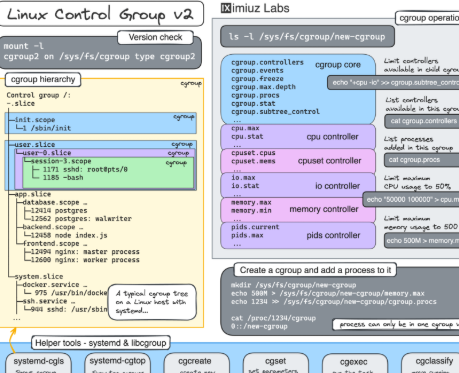
Begin by determining which cgroup version is mounted. On a typical unified hierarchy, /sys/fs/cgroup is mounted as cgroup2. Inspect the mount information and the filesystem type rather than assuming the host uses the same configuration as another distribution. A system can use different cgroup arrangements depending on kernel, boot parameters, and service-manager configuration.
A quick inspection is:
stat -fc %T /sys/fs/cgroup
mount | grep cgroup
The first command commonly reports cgroup2fs for a cgroup v2 hierarchy. If it reports a different result or the mount is absent, stop and identify the host's actual resource-control configuration before following v2-specific instructions.
Record the kernel version, distribution, container runtime, and init system as well. These details help explain which controllers and management interfaces are available. Do not write directly to cgroup control files until you know which manager owns the workload and how changes should be made persistently.
Find the Workload's cgroup
The first challenge is locating the cgroup for the process that experienced the problem. Each process exposes its cgroup membership through /proc/<PID>/cgroup. On a unified hierarchy, the entry commonly identifies a path beneath the cgroup2 mount. Use the service manager or container runtime to connect the process ID with the expected unit or container.
For example:
cat /proc/1234/cgroup
Replace the PID with the actual process. The path is meaningful only in the context of the host's cgroup mount and namespace arrangement. A container may see a different view of the hierarchy from the host. Inspect from the host when you need to understand the limits applied by the host's manager.
Avoid guessing the cgroup directory from the process name. Several instances may share a service prefix, and a supervisor may place child processes in a separate subgroup. Confirm the process membership before reading counters or changing limits. A wrong directory can lead to a completely unrelated diagnosis. For a related practical reference, see Linux memory and compare its guidance with the conditions in this example.
Read Current Usage and the Effective Limit
In cgroup v2, memory.current reports current memory usage for the cgroup and its descendants, while memory.max defines a hard limit when one is configured. The value max means no finite limit is set at that level. The effective limit can still be constrained by a parent cgroup, so inspect the hierarchy rather than examining only the leaf.
For a located cgroup directory, read:
cat /sys/fs/cgroup/path/to/group/memory.current
cat /sys/fs/cgroup/path/to/group/memory.max
Replace the path with the verified cgroup path. Values are expressed in bytes. Convert them carefully and record the timestamp. A single snapshot cannot establish whether the workload was near the limit at the time of failure; collect repeated observations or use monitoring history when available.
If the service is managed by systemd, inspect its resource-control properties as well as the cgroup files. The manager may define MemoryMax= or related settings in a unit or drop-in. The cgroup files show the kernel-facing state at the time of reading, while the unit configuration explains how that state was requested.
Understand memory.high and memory.max
Cgroup v2 offers more than one memory threshold. memory.high is a high boundary that can cause a cgroup to experience reclaim pressure and throttling behavior when usage exceeds it. It is not the same as a hard cap. memory.max is the hard limit that can lead to memory cgroup OOM handling when the limit cannot be met after reclaim.
A workload crossing memory.high may slow down before it reaches memory.max. This distinction matters when diagnosing latency rather than outright process termination. Inspect the values at the affected cgroup and its parents, and compare them with the workload's normal memory profile. A low high threshold may cause persistent reclaim activity even when the hard limit is not reached.
Do not automatically set memory.high equal to memory.max. The high threshold can be used to signal pressure earlier and shape reclaim behavior, while the hard cap protects the system from unbounded consumption. The correct relationship depends on the workload and the control policy used by the host.
Inspect memory.events for Limit Pressure
The memory.events file records counters such as high, max, oom, and oom_kill events in cgroup v2. These counters help distinguish ordinary usage from pressure and OOM activity. A value greater than zero means the corresponding event has occurred during the counter's lifetime, not necessarily during the current incident. Record the values and compare them over time or with a known incident window.
Use:
cat /sys/fs/cgroup/path/to/group/memory.events
The memory.events.local file, when available, reports events local to the cgroup rather than including descendant events. This distinction is useful when a parent group contains multiple child workloads. Choose the counter that matches the question you are investigating.
An increasing oom_kill count is stronger evidence of a cgroup OOM kill than simply seeing a service restart. Correlate the counter with kernel journal messages, container events, and the process exit time. A counter alone does not identify which allocation pattern caused the pressure.
Use memory.stat to Understand the Composition
The memory.stat file breaks memory usage into categories such as anonymous memory, file-backed memory, kernel memory categories, and other accounting fields. The exact set of entries depends on the kernel version. This view is useful because two workloads with the same memory.current value may have different memory behavior.
A service that retains a large anonymous working set may need application-level investigation. A workload using substantial file cache may respond differently to reclaim. Kernel memory categories can also be relevant for networking or filesystem-heavy workloads. Avoid treating each line as an independent amount that can be added without understanding how the counters relate; use the kernel documentation for the running version.
Capture memory.stat at normal load and during the failure window. Compare the changes rather than focusing only on the largest current value. If anonymous memory rises steadily, inspect application allocation and worker concurrency. If file-backed memory grows during an ingestion job, check whether that cache is expected and whether the workload's limit is appropriately sized. This topic also connects with resource limits, especially when documenting the result for another operator or learner.
Inspect Pressure Stall Information
Pressure Stall Information (PSI) provides a view of time that tasks spend stalled because of resource pressure. The memory PSI files can show whether workloads are spending noticeable time waiting for memory resources. PSI complements usage counters: a cgroup may be near a limit without causing severe user-visible effects, while another may experience significant stalls before reaching a hard cap.
Inspect the relevant memory.pressure file where supported. The output includes averages over different time windows and cumulative stall time. Compare these values over time and relate them to application latency. PSI is not a direct measure of “percent RAM used”; it describes the impact of pressure on tasks.
If memory pressure averages increase alongside slow request times, that correlation supports further investigation. Check whether the workload is also crossing memory.high or generating reclaim events. A service that is slow but has no OOM events may still be constrained by reclaim and should not be dismissed as healthy.
Correlate Kernel and Service Logs
When a process is killed or a container restarts, inspect both the kernel journal and the service's logs. The kernel may record a memory cgroup OOM event and identify a process involved. The service manager may record the exit status and restart behavior. The container runtime may record an event describing the container's termination.
Use a time-bounded query such as:
journalctl -k --since "30 minutes ago" --no-pager
Then inspect the service or container logs around the same time. Be careful with privacy when sharing output because process names, command lines, and environment details may be sensitive. A restart message does not by itself prove an OOM kill; correlate it with the kernel and cgroup evidence.
If the kernel reports a cgroup OOM kill, identify the affected cgroup and inspect its counters. If no such event appears, investigate other exit causes such as application exceptions, signals, health-check failures, or host-level OOM conditions. Do not increase memory limits until the failure mechanism is known.
Choose a Corrective Action and Verify It
If evidence shows that a legitimate workload has outgrown its resource budget, evaluate a limit change against host capacity and competing workloads. Consider reducing concurrency, bounding queues, improving cache behavior, or splitting work before simply raising the hard limit. If usage is growing because of a leak, increasing the limit may only postpone the next incident.
Make changes through the system that manages the cgroup, such as the relevant systemd unit or container configuration. Directly writing to cgroup files can be temporary and may conflict with the manager's desired state. Test changes in a controlled environment, monitor usage and PSI, and confirm that the application remains stable under representative load.
A good verification compares pre-change and post-change behavior: peak memory, memory.events, PSI, request latency, restart count, and successful workload completion. Keep the original values and a rollback plan. A larger limit is justified only when it supports a measured requirement and does not create unacceptable pressure elsewhere on the host.
Example: A Container Restarts While Host RAM Looks Available
A containerized API restarts during a traffic increase. Host monitoring shows available memory, so the first assumption is that the application crashed for an unrelated reason. The operator inspects the host process membership and locates the container's cgroup. memory.current is close to memory.max, and the oom_kill counter has increased since the last baseline.
The operator then reviews memory.stat and discovers that anonymous memory grows as the request worker count increases. PSI also rises during the same period, and the kernel journal records a memory cgroup OOM event. The evidence shows that the container is constrained by its own limit even though the host has capacity outside that cgroup.
The team checks whether each worker needs the observed memory and whether requests are retaining large objects. It tests a lower concurrency setting and a measured limit adjustment in staging. After deployment, it compares peak memory, PSI, OOM counters, and request latency. The fix addresses both the workload's memory profile and its resource budget instead of treating host free RAM as the only relevant number.
Practice Exercise
In a disposable test environment, create a cgroup-managed workload or use a supported container runtime to impose a finite memory limit. Generate a controlled memory workload and observe memory.current, memory.max, memory.events, and PSI where available. Do not run memory exhaustion tests on a shared or production host. Record which counters change and how the workload responds as it approaches the limit.
cgroup v2 memory investigation checklist
- Confirm that the host uses a unified cgroup v2 hierarchy.
- Identify the exact cgroup for the affected process.
- Inspect current usage and parent as well as leaf limits.
- Distinguish
memory.highfrommemory.max. - Compare
memory.eventsandmemory.events.local. - Review
memory.statfor usage composition. - Correlate PSI with application latency.
- Inspect kernel, service, and container logs.
- Change limits through the owning manager and verify the result.
Conclusion
Cgroup v2 memory limits explain why a workload can fail while the host still appears to have spare RAM. The relevant boundary may belong to a service, container, or parent cgroup. Usage, hard limits, pressure counters, statistics, and kernel logs must be read together to identify the real constraint.
Avoid treating a larger limit as the default fix. Validate the cgroup path, understand whether pressure is caused by workload growth or inefficient memory use, and make changes through the manager that owns the configuration. Use cgroup memory concepts to connect kernel accounting with application behavior. A measured investigation is safer than guessing from the host's free-memory value.
Comments
Join the discussionNo comments yet. Be the first to comment.